


Campus Climate results highlight disparities in experience
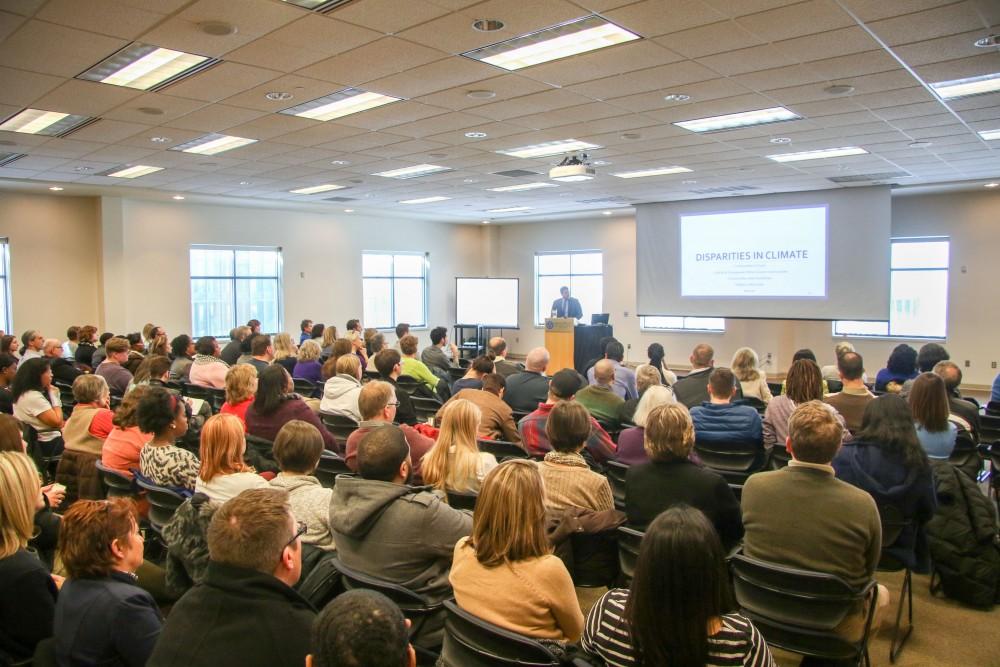
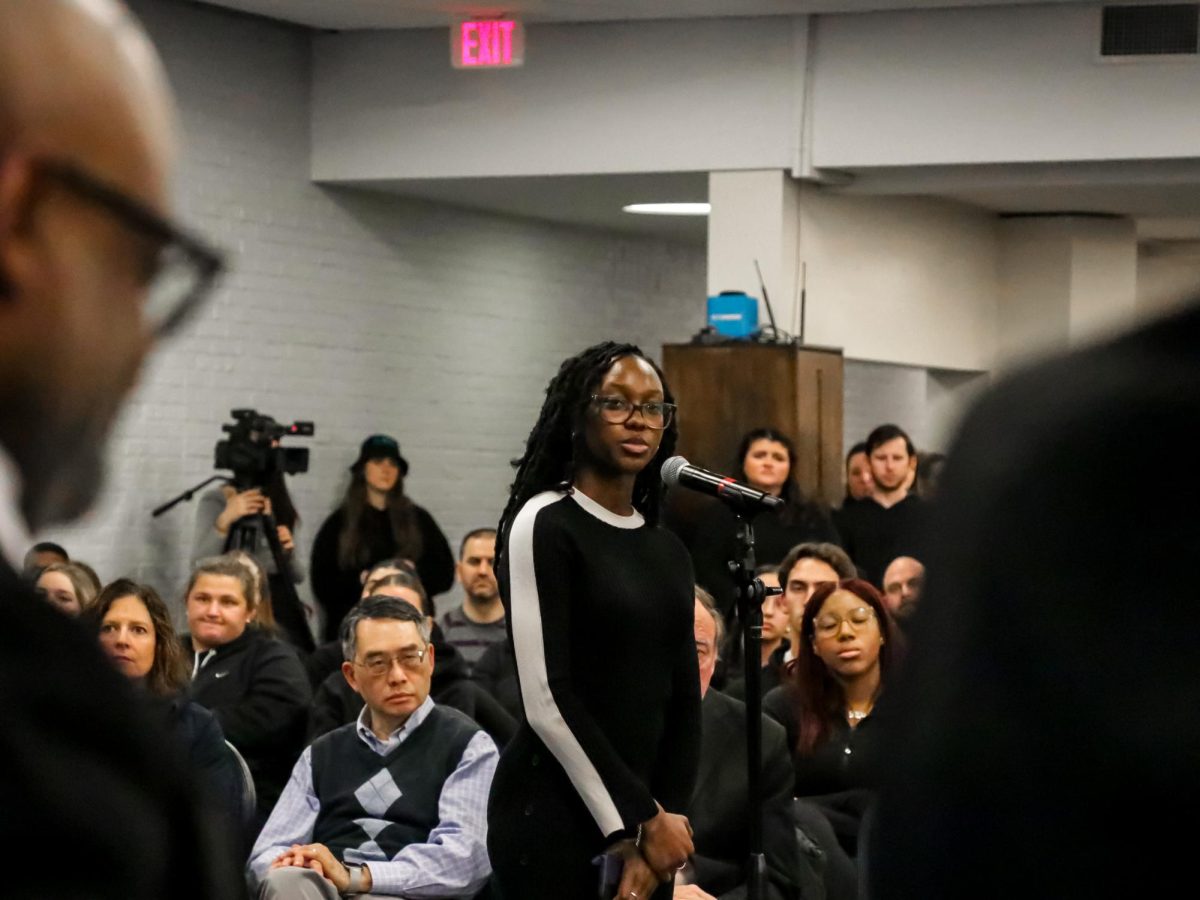
GVL / Sara Carte – Dr. Jesse M. Bernal, Vice president for the Inclusion and Equity, speaks at the myGVSU Climate Survey Results meeting in the Kirkhof Center on Wednesday, Mar. 2, 2016.
Mar 3, 2016
This year, 15,400 Grand Valley State University students, faculty and staff completed the fifth annual Campus Climate Survey. Jesse Bernal, vice president of the Division of Inclusion and Equity, presented the preliminary findings on March 2 in the Pere Marquette Room of the Kirkhof Center.
Bernal called the survey’s response rate a “massive success” at 42 percent, 14 points higher than the national average of 28 percent. This is the highest response rate GVSU has ever reported for a Campus Climate Survey.
While faculty and staff reported a decrease in comfort on campus since 2011, Bernal noted that 87 percent of respondents said they felt “comfortable” or “very comfortable” this year. The national average is 78 percent.
Bernal broke the findings down into four categories: experiences, demographics, perceptions and institutional actions.
Students reported the most positive perception of overall climate, with 88 percent saying they felt “comfortable” or “very comfortable,” as compared to 77 percent for faculty.
Approximately 24.5 percent of faculty and staff reported at least one negative experience on campus, while only 12 percent of students did. Overall, 14 percent of the respondents said they had a negative experience, up from 11 percent in 2011.
Bernal also broke down individual findings within individual communities on campus. The survey found that 40 percent of respondents who identify as transgender reported having at least one negative experience that affected their ability to live, learn or work at GVSU. For LGBQA respondents, 26 percent reported such an experience, as did 24 percent of respondents with a disability. The national average is 23 percent.
“This is the heart of the research and how we plan to grow as an institution, ensuring that we create a more welcome and inviting campus climate,” Bernal said.
Bernal said one of the most interesting findings is the disparity between how the entire community thinks certain groups on campus feel, compared to how those groups actually responded to the survey.
For example, the overall community believed the campus was more accessible to disabled people than disabled people believe it to be. Respondents also thought the campus was more positive for LGBQA people, transgender people and people of color than members of those groups said it is.
Despite this, the percentage of respondents who “agree” or “highly agree” that GVSU is committed to diversity increased from 62 percent in 2011 to 70 percent in 2015.
Bernal stressed that these are only initial findings, and that further analysis will be required to draw conclusions from the data. Future analysis will also take intersectional identities into account, such as LGBQA people of color.
“We’re thinking about taking a strengths-based approach,” Bernal said. “If we identify a unit that’s doing exceptionally well in terms of climate, even for some of our marginalized or underrepresented communities, how do we understand how they’re doing that, what are they doing differently…and how we can learn from them?”
Andrew Plague, project assistant for the Division of Inclusion and Equity, said the fact that GVSU performs such a survey is important.
“I think it shows there’s a real institutional commitment to maintaining and improving the campus climate,” he said.
The full report will be released in mid-March, and volunteer “action teams” will be created to address some of the problems uncovered by the survey at that time.
For more information and to download a PDF file of the preliminary results, visit www.gvsu.edu/mygvsu.